

Australia has the highest rooftop solar uptake in the world, and most of us are now on some flavour of time-of-use billing. Yet the app that came with your inverter probably shows you a pretty generation curve and nothing about what your electricity actually cost yesterday.
Home Assistant's built-in Energy dashboard can do that job properly — but only if you feed it the right sensors and tell it your tariff structure. This guide walks through the whole chain: getting solar and grid data in, splitting import from export, layering time-of-use pricing on top, and checking the result against a real bill.
The short version: what the Energy dashboard actually needs
Before you install anything, understand the shape of the data Home Assistant wants. The Energy dashboard is fussy about one thing above all: it needs cumulative kWh sensors with state_class: total_increasing, not instantaneous watts.
At minimum you want four entities:
- Grid consumption — total kWh imported from the grid
- Return to grid — total kWh exported
- Solar production — total kWh generated by your panels
- Battery in/out — if you have storage
If your inverter or meter only publishes power in watts, you convert it using the Riemann sum integral helper (Settings → Devices & Services → Helpers → Integration), set to the trapezoidal method with kilowatt-hour output. It's an approximation, so expect it to drift a percent or two from your retailer's meter — fine for insight, not for disputing a bill.
Getting solar and grid data into Home Assistant
Start with your inverter. Home Assistant has first-party or well-maintained community integrations for Fronius, SMA, Enphase Envoy, SolarEdge, GoodWe, Sungrow (via Modbus TCP), Huawei SUN2000 and Tesla Powerwall [VERIFY current integration status for your specific model]. Local polling over your LAN is always preferable to a cloud API — it survives internet outages and won't get rate-limited.
The catch: many inverters report solar generation and site consumption, but not clean bidirectional grid figures unless you've had a consumption CT fitted at the switchboard. Without it, Home Assistant can't tell the difference between "exporting 3 kW" and "self-consuming 3 kW".
That's where a dedicated bidirectional meter earns its place. A CT-clamp WiFi meter sits on your main tails and reports import and export separately, independent of the inverter brand.
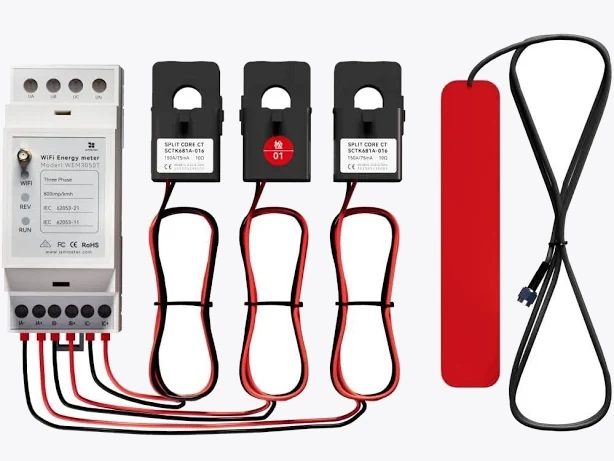
IAMMETER WEM3050T WiFi Energy Meter
On specification, this class of device does single-phase bidirectional measurement and publishes over WiFi via Modbus TCP or MQTT, which is exactly what a local Home Assistant install wants [VERIFY model-specific protocol support and three-phase variants].
Electrical warning, plainly stated: installing CT clamps around main conductors inside a switchboard is electrical work. In Australia this must be carried out by a licensed electrician under AS/NZS 3000 — it is not a DIY job, regardless of what an overseas YouTube video shows [VERIFY current requirements with your state's electrical regulator]. Budget for a sparky call-out on top of the hardware cost.
A no-touch alternative: some retailers and smart meter providers expose a data feed you can pull, and devices that read the meter's optical or Zigbee port exist in the AU market [VERIFY availability and retailer support in your distribution zone].
Splitting import from export correctly
This is where most first attempts go wrong. Bidirectional meters often publish a single signed power value — positive when importing, negative when exporting. The Energy dashboard needs two separate, always-increasing sensors.
Create two template sensors that split the signal:
template:
  - sensor:
      - name: "Grid import power"
        unit_of_measurement: "W"
        device_class: power
        state: >
          {{ [states('sensor.grid_power') | float(0), 0] | max }}
      - name: "Grid export power"
        unit_of_measurement: "W"
        device_class: power
        state: >
          {{ [states('sensor.grid_power') | float(0), 0] | min | abs }}
Then run each through its own Riemann sum integration helper to get sensor.grid_import_energy and sensor.grid_export_energy. Those are the two entities you point the Energy dashboard at.
If your meter already gives you separate lifetime import and export registers, skip all of this and use them directly — they'll be more accurate.
Layering time-of-use tariffs on top
Home Assistant supports two costing approaches per source: a fixed price, or an entity that tracks the current price per kWh. For time-of-use billing you want the second.
Build a template sensor that returns the right rate for the current time. A typical NSW-style residential ToU structure looks something like peak 2pm–8pm weekdays, shoulder either side, off-peak overnight — but your windows and rates are set by your distributor and retailer and will differ, so read your own bill rather than copying mine [VERIFY your tariff periods, and note that many distributors have shifted peak windows to the late afternoon/evening to reflect solar soak].
template:
  - sensor:
      - name: "Electricity import price"
        unit_of_measurement: "AUD/kWh"
        state: >
          {% set h = now().hour %}
          {% set weekday = now().weekday() < 5 %}
          {% if weekday and 14 <= h < 20 %}
            0.5400
          {% elif 7 <= h < 22 %}
            0.3100
          {% else %}
            0.2200
          {% endif %}
Those figures are placeholders [VERIFY against your own retail plan — rates vary widely by state, distributor and plan].
Do the same for your feed-in tariff and attach it to the "Return to grid" source. Most FiTs are now a flat single figure, but a growing number of retailers offer time-varying export rates, and wholesale-exposed plans change every five or thirty minutes — in which case an integration that pulls live pricing is a better fit than a hardcoded template [VERIFY plan specifics].
For per-period totals rather than just costs, add a utility_meter with tariffs:
utility_meter:
  daily_grid_import:
    source: sensor.grid_import_energy
    cycle: daily
    tariffs:
      - peak
      - shoulder
      - offpeak
Then write a simple time-triggered automation calling select.select_option on the generated select.daily_grid_import entity to switch tariffs at each boundary. Now you can see exactly how many kilowatt-hours you burn in the expensive window — which is the number that actually moves your bill.
Adding device-level monitoring and load shifting
Once the whole-house picture is right, individual circuits tell you where to act. The Energy dashboard has a separate "Individual devices" section for exactly this.
Zigbee smart plugs with energy metering are the cheapest way in, and running them through a local coordinator keeps everything off the cloud and off your WiFi.

SONOFF Zigbee 3.0 USB Dongle
Paired with ZHA or Zigbee2MQTT, a USB coordinator gives you a local Zigbee network for metering plugs, and Zigbee devices generally report energy as a cumulative total already — no integration helper required.
WiFi plugs are the simpler option if you'd rather not run a mesh. Just check the model number before you buy: within the Tapo range, some variants meter energy and some don't.
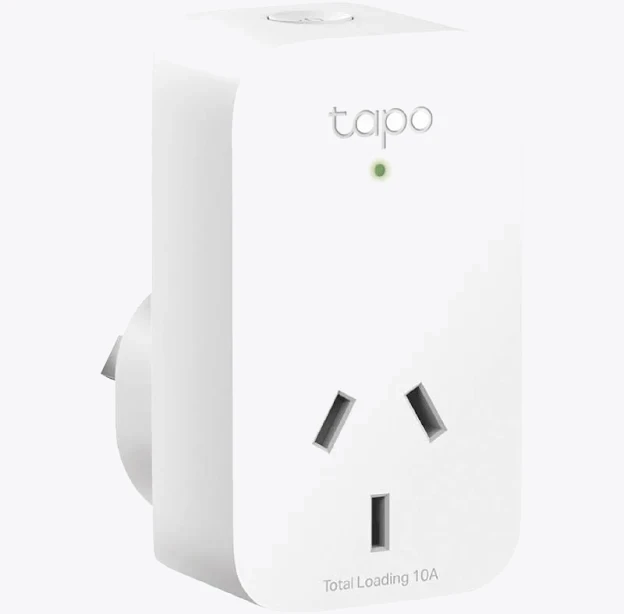
TP-Link Tapo P100 Mini Smart Wi-Fi Socket Plug
The P100 is a switching-only plug — useful for shifting a load into your solar window or off-peak period via automation, but it won't contribute a kWh figure to the dashboard. If you need the measurement as well, look for the metering variant in the same family [VERIFY current model availability and pricing at Officeworks, JB Hi-Fi and Amazon AU].
The highest-value automation here is usually the dumbest one: trigger the pool pump, dishwasher or hot water element when solar export exceeds a threshold for a sustained period, and stop when it drops. Every kilowatt-hour you self-consume is worth the difference between your import rate and your feed-in rate — often 25–35c [VERIFY against your plan].
Sanity-checking against your actual bill
Don't trust the dashboard until you've reconciled it once. Wait for a full billing period, then compare Home Assistant's total import, total export and total cost against the retailer's statement.
A few percent variance is normal — Riemann sum approximation, CT accuracy tolerance and clock drift all contribute. A twenty percent gap means something structural is wrong: usually a missed tariff boundary, daylight saving not being handled, or an inverter reporting AC output where you assumed DC.
Also check your supply charge. The Energy dashboard costs energy only; the daily fixed charge sits outside it. If you want a true bill estimate, add it as a separate template sensor and combine the two in your own Lovelace card.
Get those three things right — clean bidirectional data, correct tariff windows, one reconciliation against a real bill — and you'll have a dashboard that tells you something your inverter app never will.


